How-To Guide
The Group
The Group
The Group
How to Perform Data Quality Assurance
This guide provides a step by step walkthrough of conducting Data Quality Assurance in the Collect Module of the ECO-OS ESG Platform.
| |
|---|---|
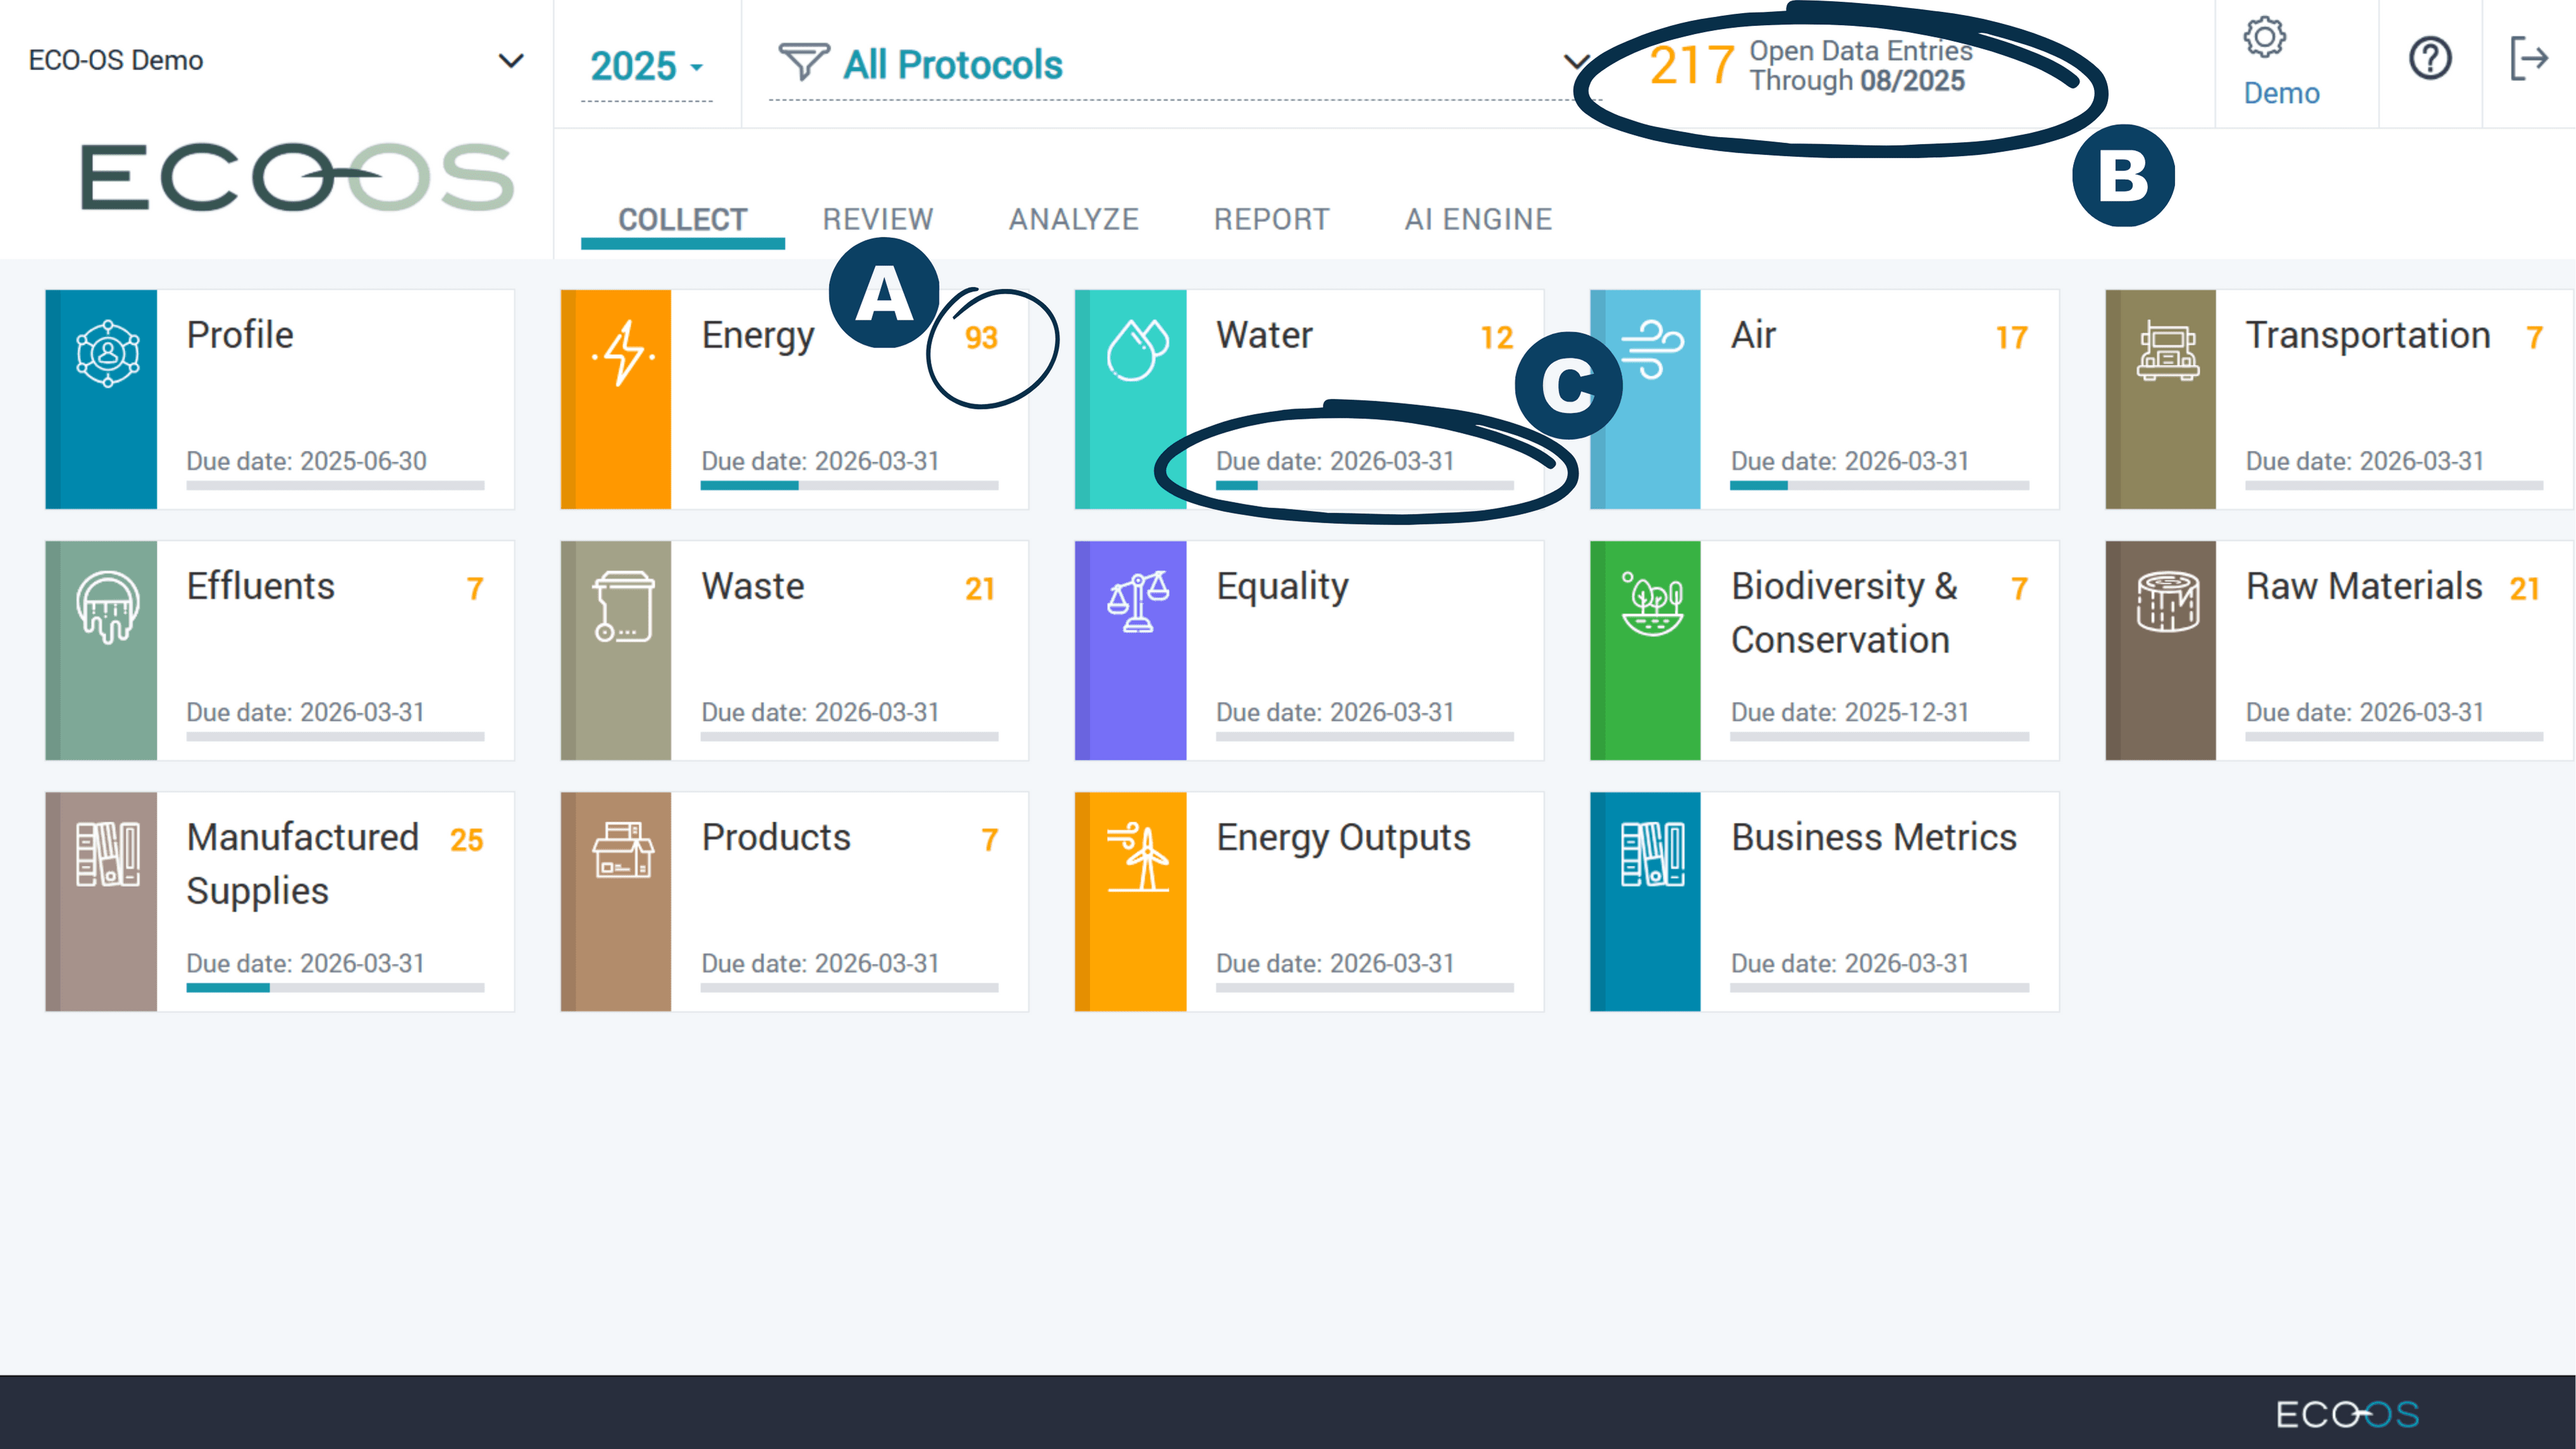
On the collect dashboard, see the number of missing data entries for each category in orange. | |
The total missing count for the selected year appears at the top. | |
A completeness bar and due date marker indicate the progress in each category. | |
 | |
| |
|---|---|
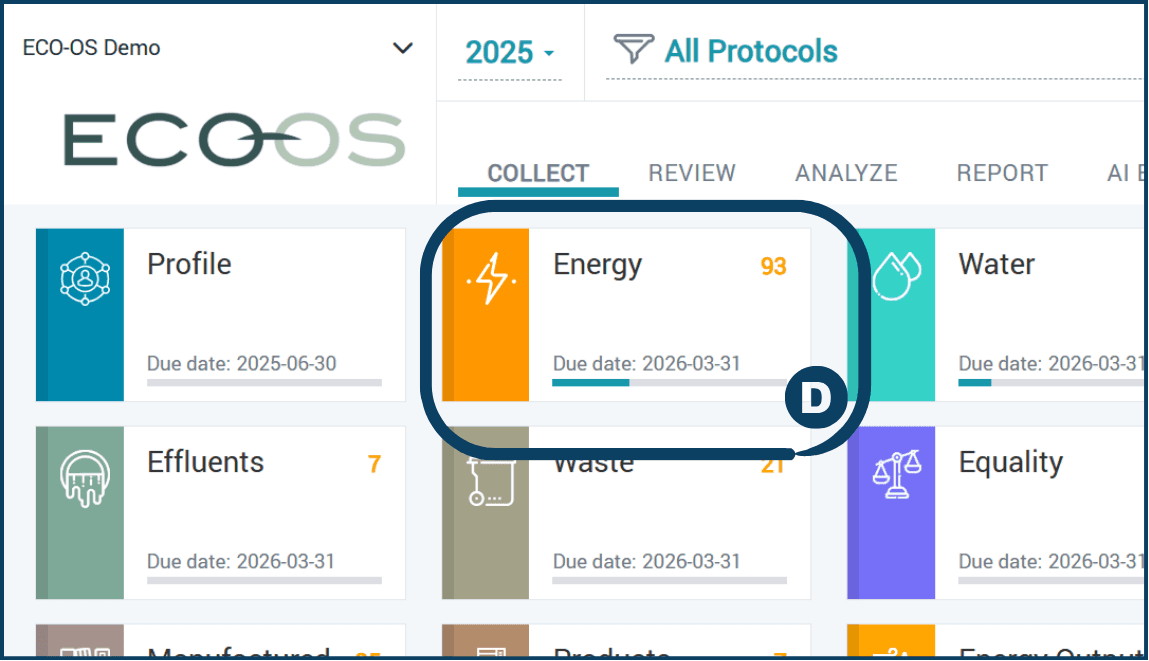
Click on the desired category you want to inspect (e.g. Energy). | |
 | |
| |
|---|---|
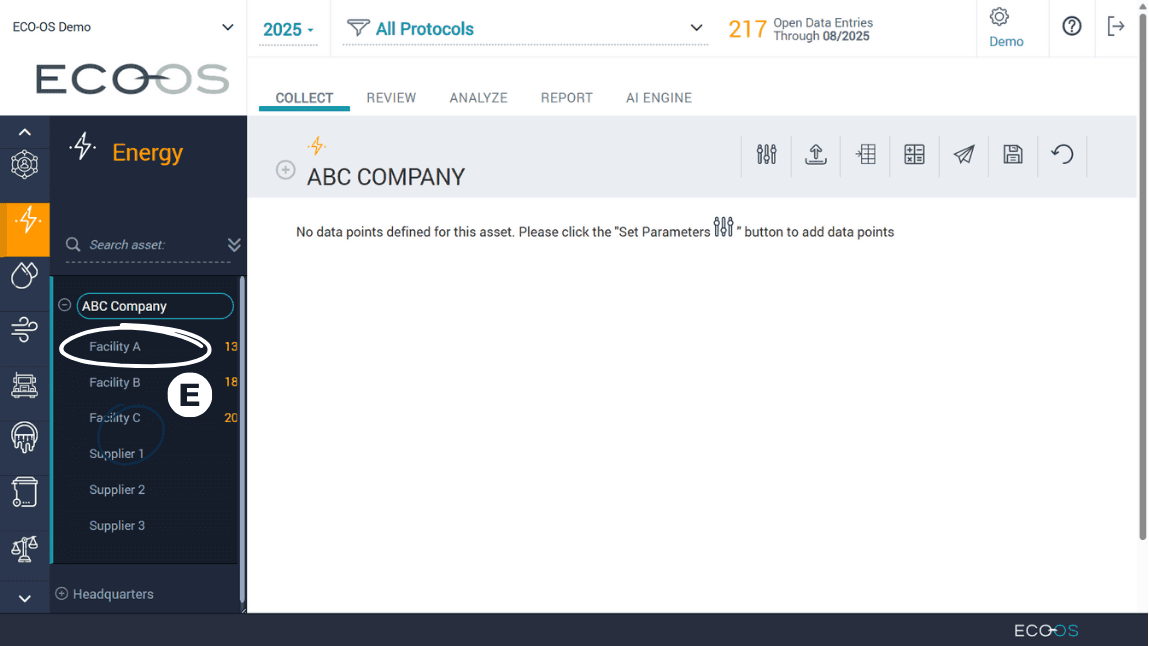
Within the chosen category, select the asset you’d like to inspect (e.g., Facility A). | |
 | |
| |
|---|---|
Click the “+” icon next to the sub-category name to view the data points. | |
 | |
| |
|---|---|
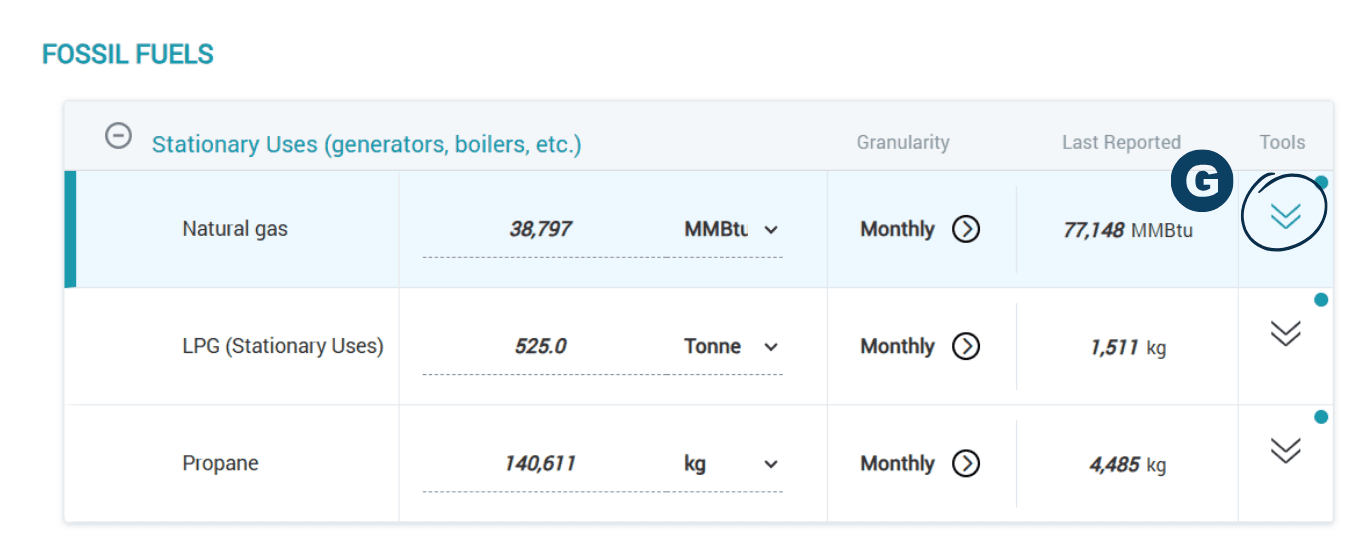
Click the double downward arrow to expand the data point toolbar. | |
 | |
| |
|---|---|
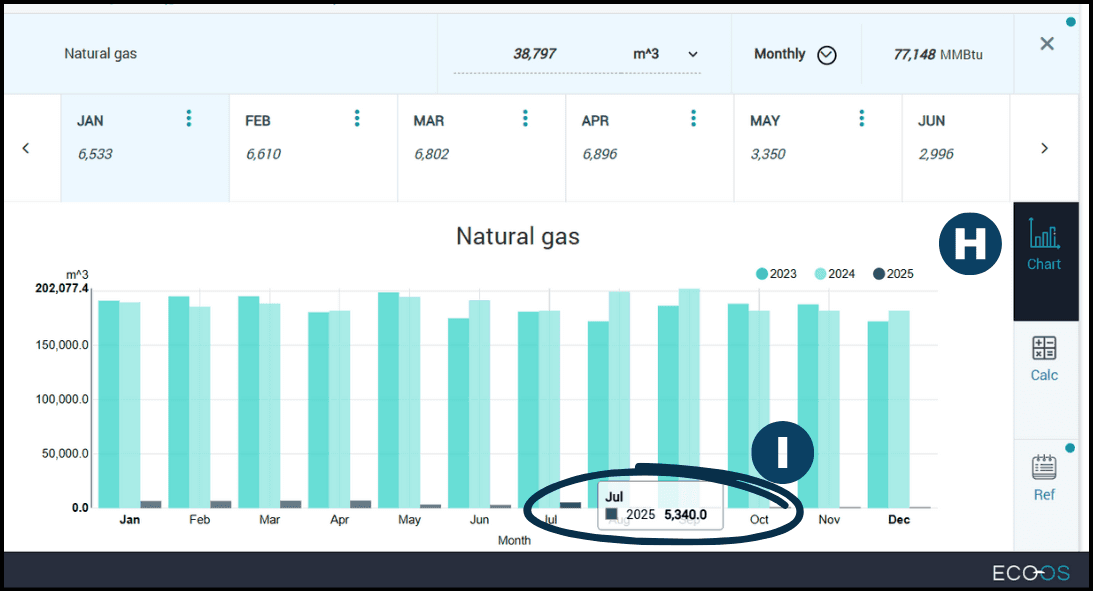
Select the “Chart” icon. This displays the values over a 3-year time period. | |
Hover over each point to see more details and spot any irregular trends. In this case, the 2025 data is significantly lower than previous years. | |
 | |
| |
|---|---|
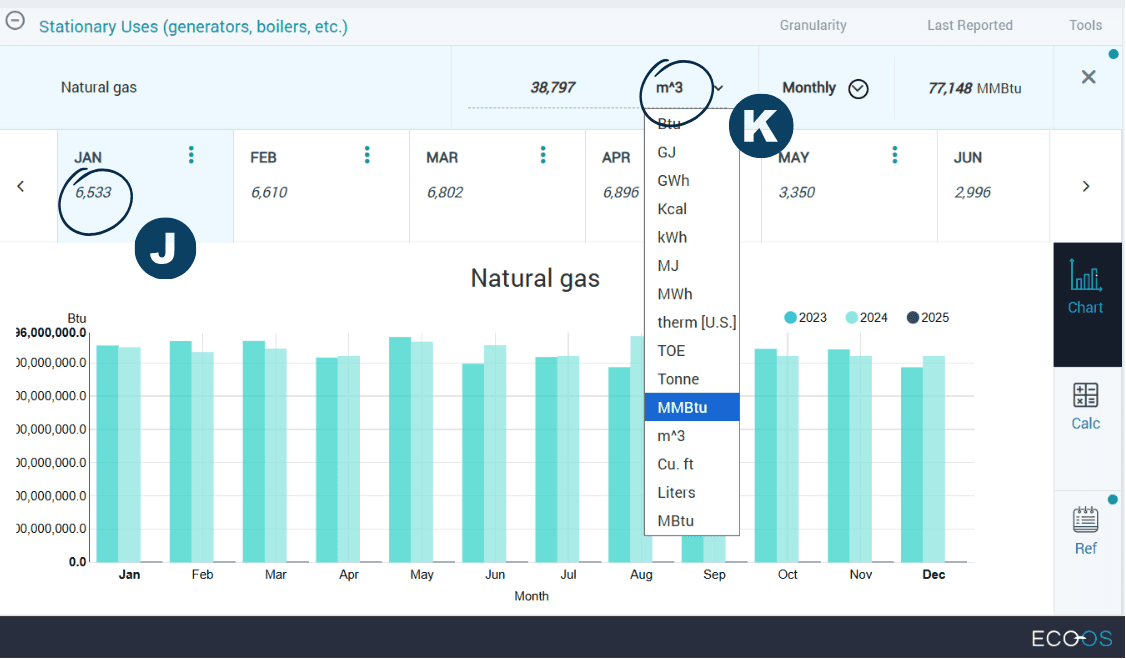
To ensure that data has been entered correctly, conduct the following actions: | |
Review monthly data against data source to ensure there are no errors. | |
Check that the units are entered in their original value. In this example, the last reported data was entered in MMBTU, and the recent data was incorrectly entered in m³. Select the correct unit from the drop-down menu. | |
Note: Non-whole numbers must be represented using a decimal point [e.g. 100.55] and not using a comma [100,55] | |
 | |
| |
|---|---|
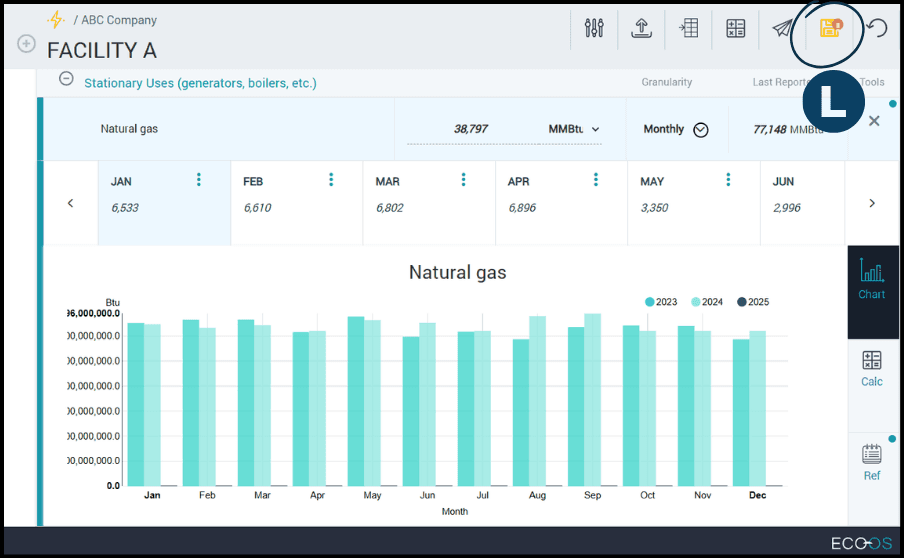
Click the blinking yellow disc icon to save your changes. | |
 | |
| |
|---|---|
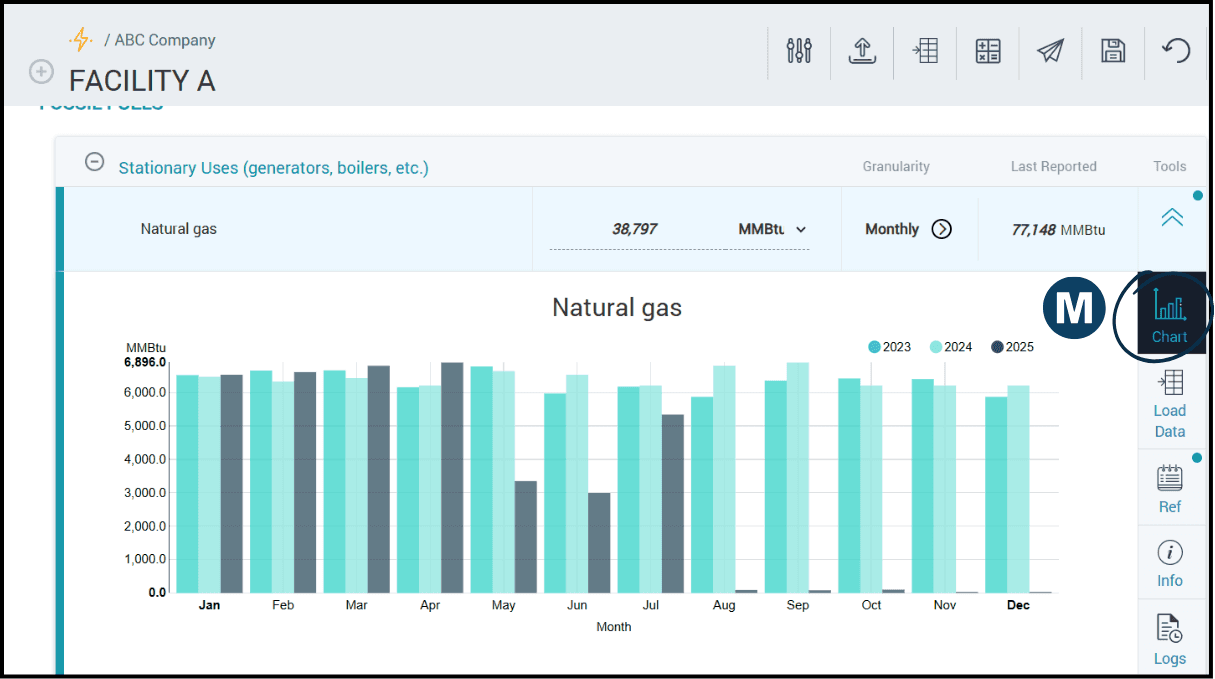
Click on the “Chart” icon or refresh the internet browser to see the chart updated with the new data. | |
 | |
| |
|---|---|
On the collect dashboard, see the number of missing data entries for each category in orange. | |
The total missing count for the selected year appears at the top. | |
A completeness bar and due date marker indicate the progress in each category. | |
| |
| |
|---|---|
Click on the desired category you want to inspect (e.g. Energy). | |
| |
| |
|---|---|
Within the chosen category, select the asset you’d like to inspect (e.g., Facility A). | |
| |
| |
|---|---|
Click the “+” icon next to the sub-category name to view the data points. | |
| |
| |
|---|---|
Click the double downward arrow to expand the data point toolbar. | |
| |
| |
|---|---|
Select the “Chart” icon. This displays the values over a 3-year time period. | |
Hover over each point to see more details and spot any irregular trends. In this case, the 2025 data is significantly lower than previous years. | |
| |
| |
|---|---|
To ensure that data has been entered correctly, conduct the following actions: | |
Review monthly data against data source to ensure there are no errors. | |
Check that the units are entered in their original value. In this example, the last reported data was entered in MMBTU, and the recent data was incorrectly entered in m³. Select the correct unit from the drop-down menu. | |
Note: Non-whole numbers must be represented using a decimal point [e.g. 100.55] and not using a comma [100,55] | |
| |
| |
|---|---|
Click the blinking yellow disc icon to save your changes. | |
| |
| |
|---|---|
Click on the “Chart” icon or refresh the internet browser to see the chart updated with the new data. | |
| |
Subscribe to our Mailing List
Join our list for product news, expert-led webinars, industry updates, and insights from the blog— never spammy, always actionable. Unsubscribe anytime.