Anomaly Flagging

ECO-OS provides visual indicators to help you quickly identify inconsistencies or unusual values during data collection.

These indicators appear at the data point level, allowing you to quickly locate areas that may need attention. This walkthrough explains how to recognize these indicators and what they mean.

Search keywords:
Data Management, Anomalies, Audit, Data Validation, Exclamation Mark

  1. Inconsistent Units

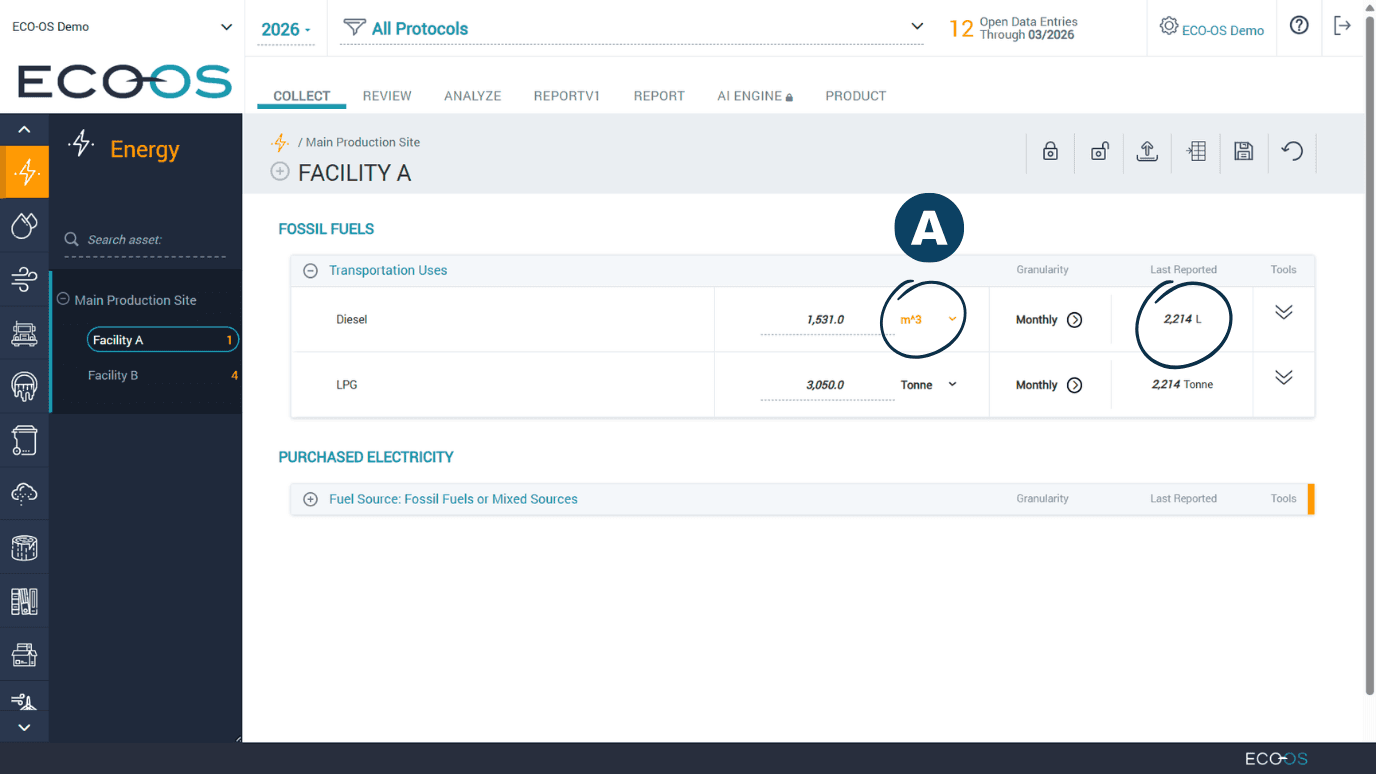
If the unit selected for a data point differs from the unit used in the last reported value, the unit dropdown will appear in orange. Hovering over the unit will display a tool tip with more detail.

This helps flag potential unintended inconsistencies between reporting periods.

  1. Identifying Data Anomalies

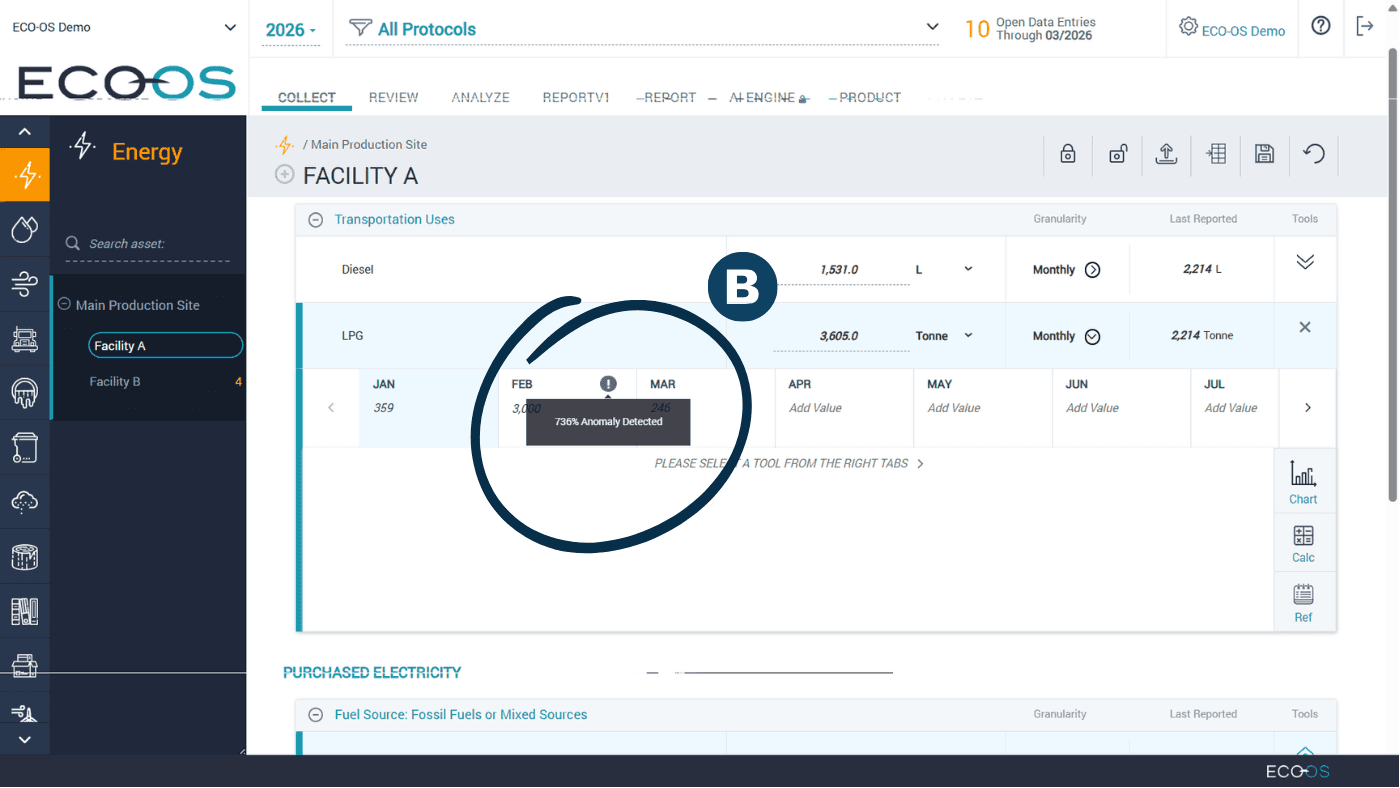
If a monthly value differs significantly from the other values, it is highlighted for review with an (i) notation.

Hover over the (i) icon for a tooltip that will explain how much the value deviates from the median.


  1. Inconsistent Units

If the unit selected for a data point differs from the unit used in the last reported value, the unit dropdown will appear in orange. Hovering over the unit will display a tool tip with more detail.

This helps flag potential unintended inconsistencies between reporting periods.

  1. Identifying Data Anomalies

If a monthly value differs significantly from the other values, it is highlighted for review with an (i) notation.

Hover over the (i) icon for a tooltip that will explain how much the value deviates from the median.


Have questions about this guide or need more support?
Check out the rest of the ECO-OS Academy content, or contact our support team: support@ecoos.co

Visit the Academy

Subscribe to our Mailing List

Join our list for product news, expert-led webinars, industry updates, and insights from the blog— never spammy, always actionable. Unsubscribe anytime.