
Introduction to "Review" Module
View ESG results in clear, actionable detail
Visualize high-level trends across emissions, waste, water, and more
Quickly pinpoint the source of outliers and inefficiencies
Organize results by asset, facility, or emission type for clarity
| |
|---|---|
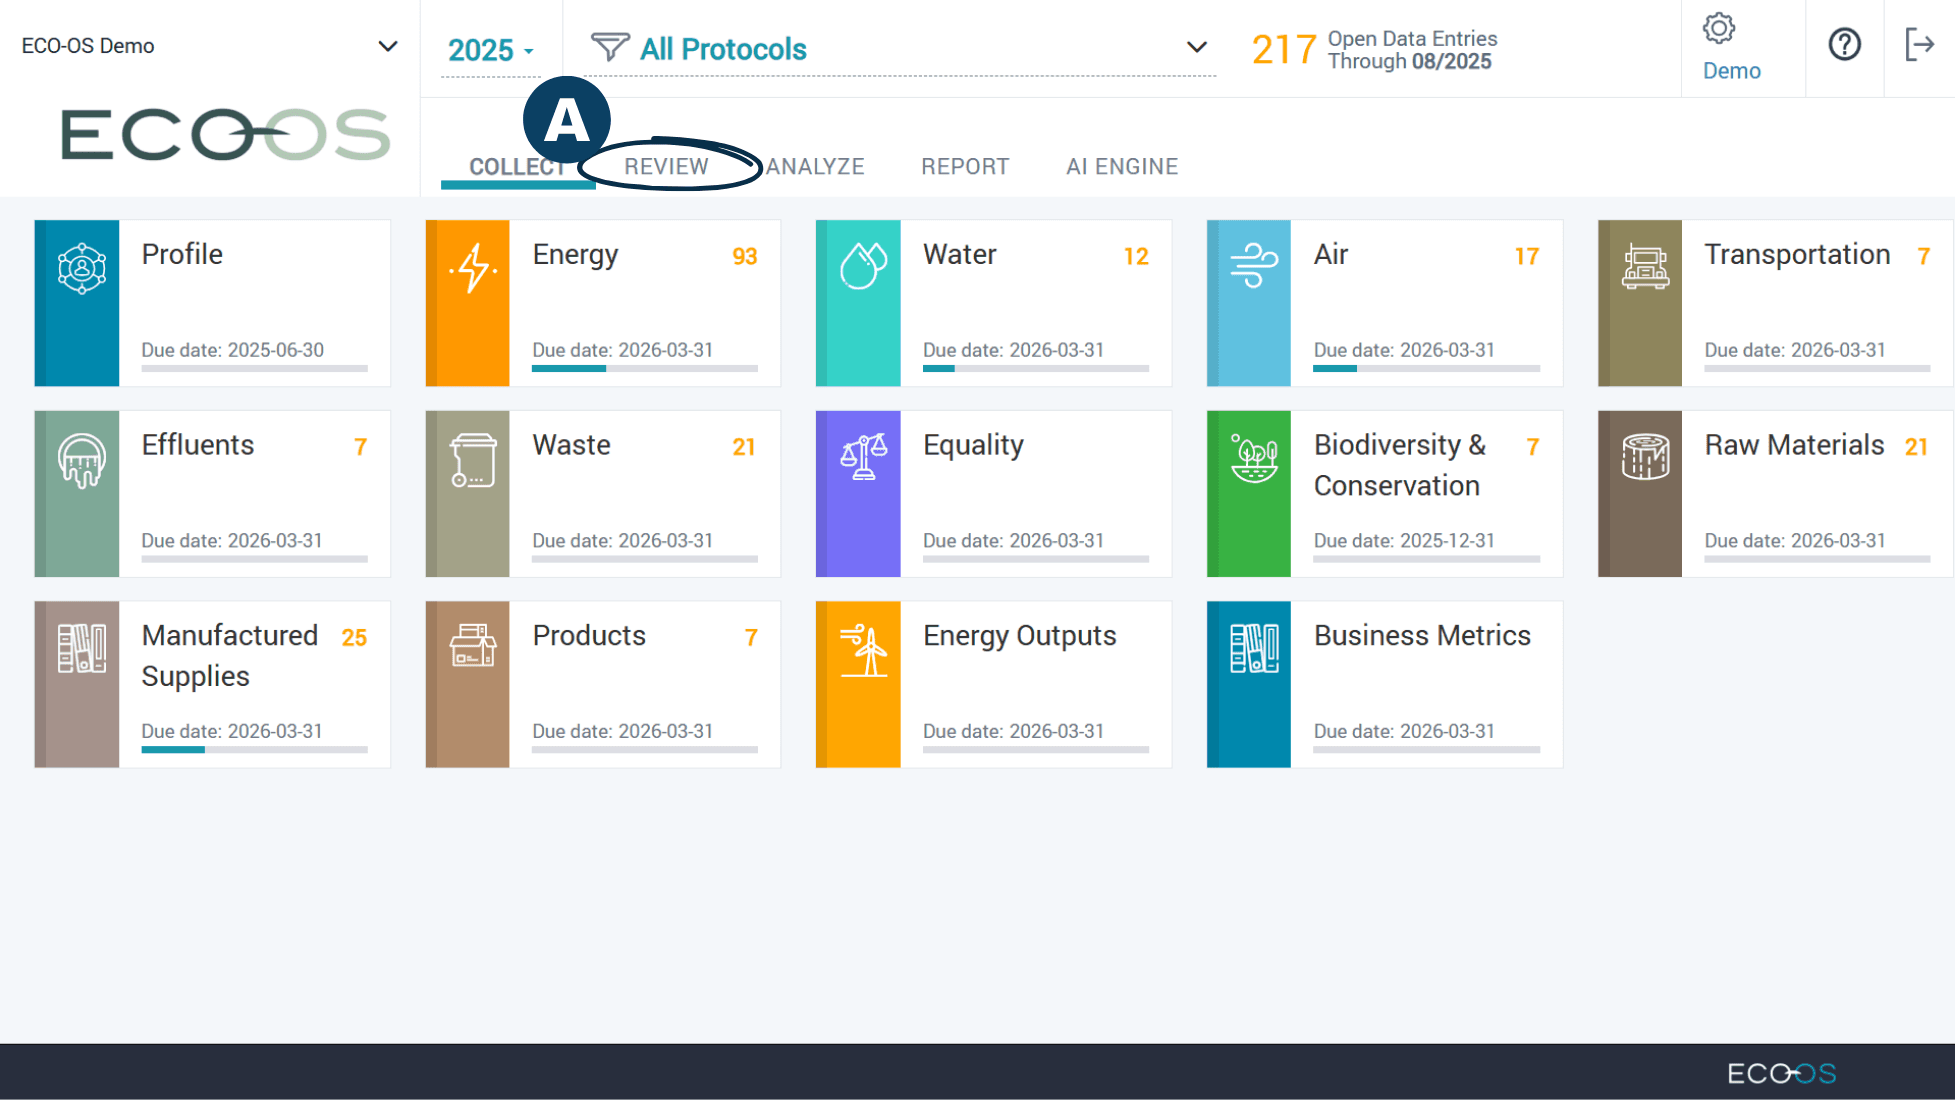
 | From the main dashboard, click the “Review” tab to enter the Review Module. |
 | |
| |
|---|---|
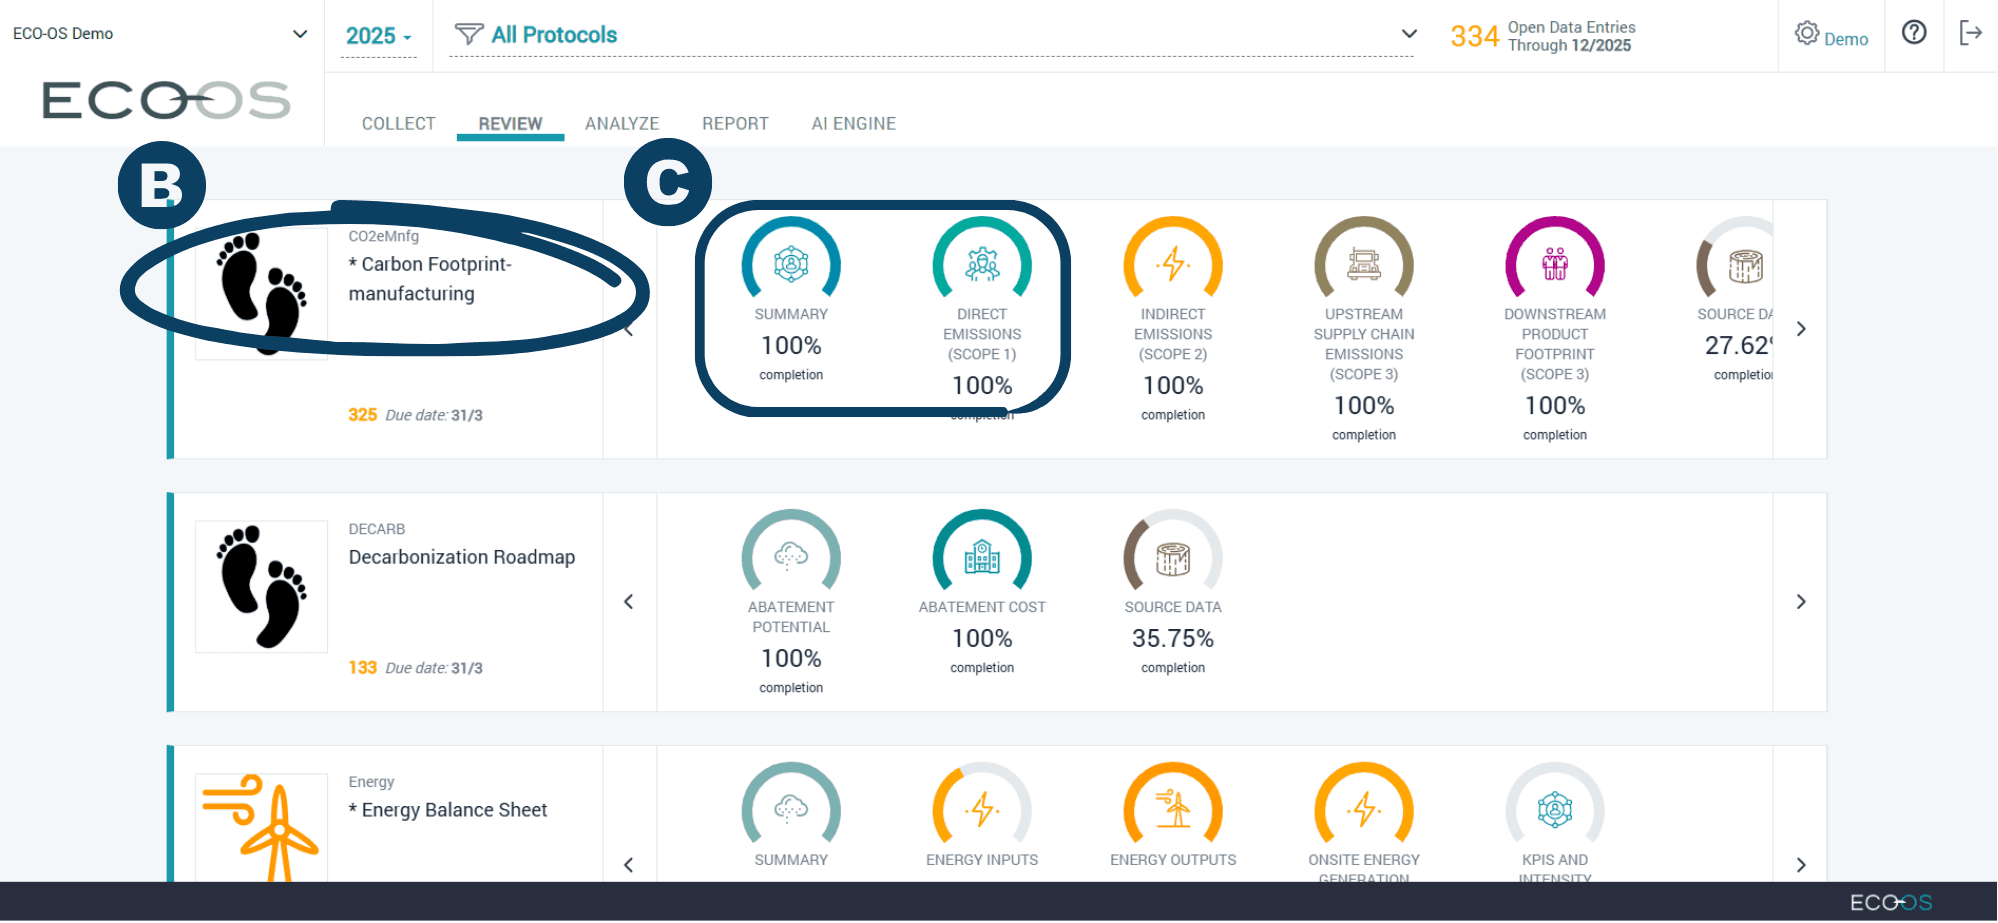
 | Select a protocol that you would like to review. |
 | Within that protocol, choose the results category to open (e.g. GHG Protocol Summary, Direct Emissions (Scope 1), etc.) |
 | |
| |
|---|---|
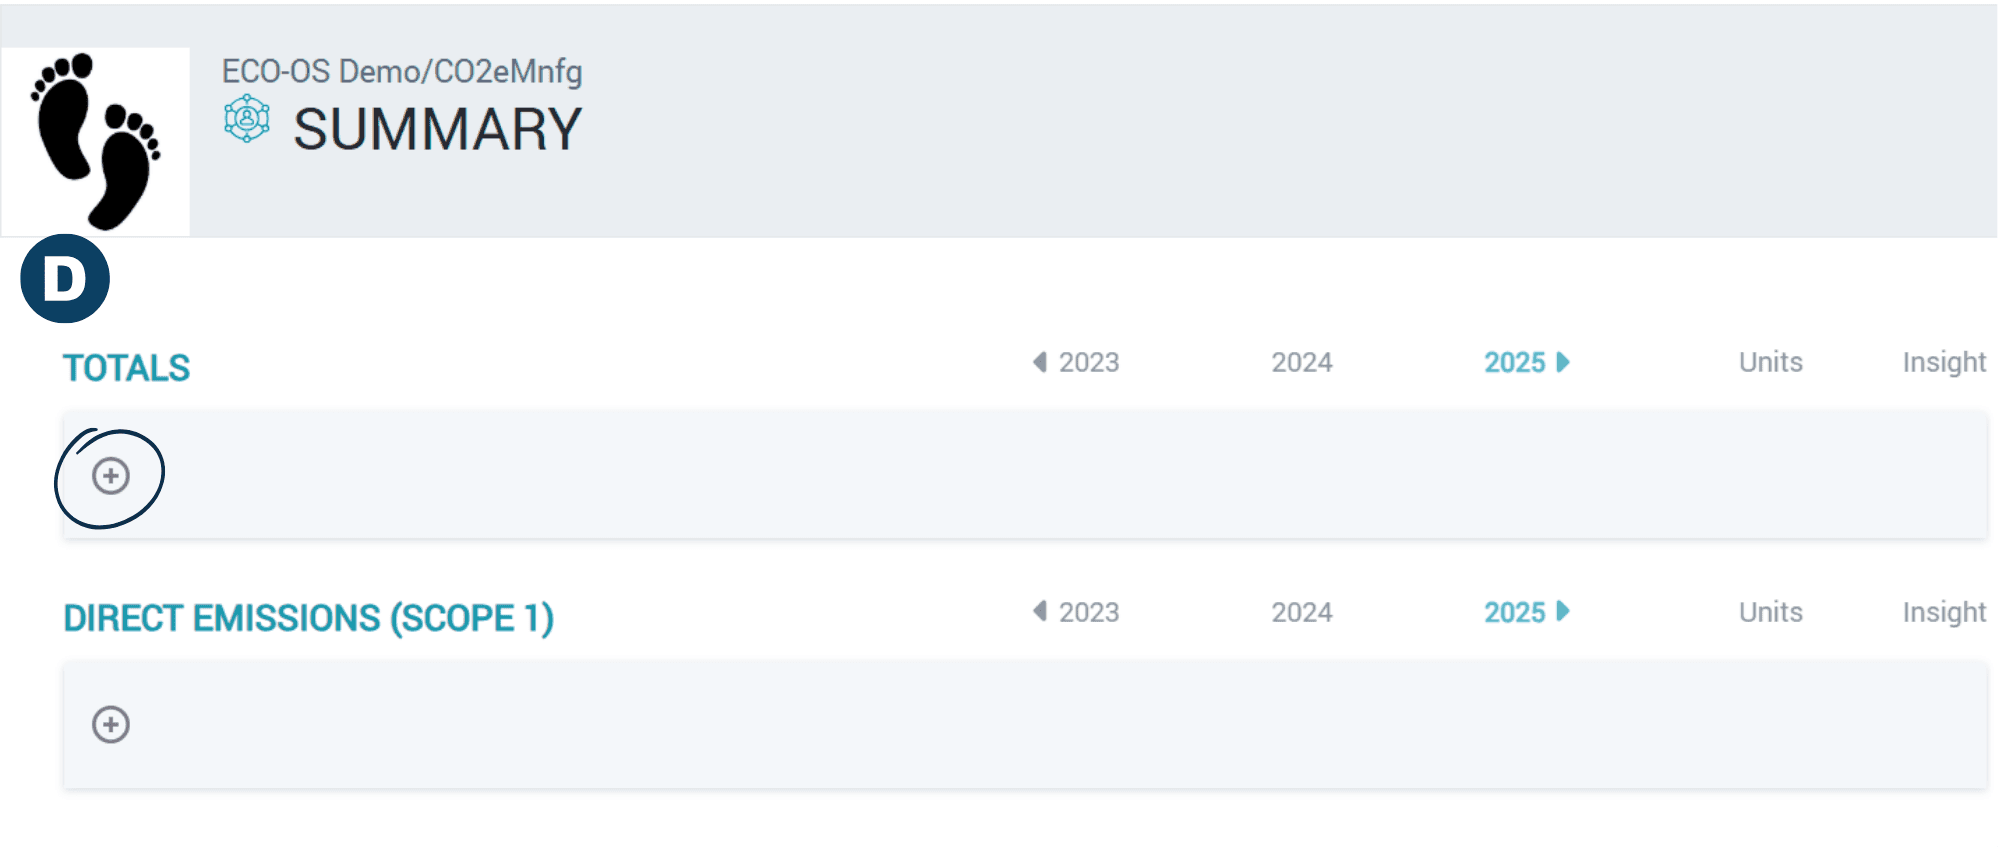
 | Click the ”+” icon to expand the "Totals" section to see a high-level summary of your calculated results. |
 | |
| |
|---|---|
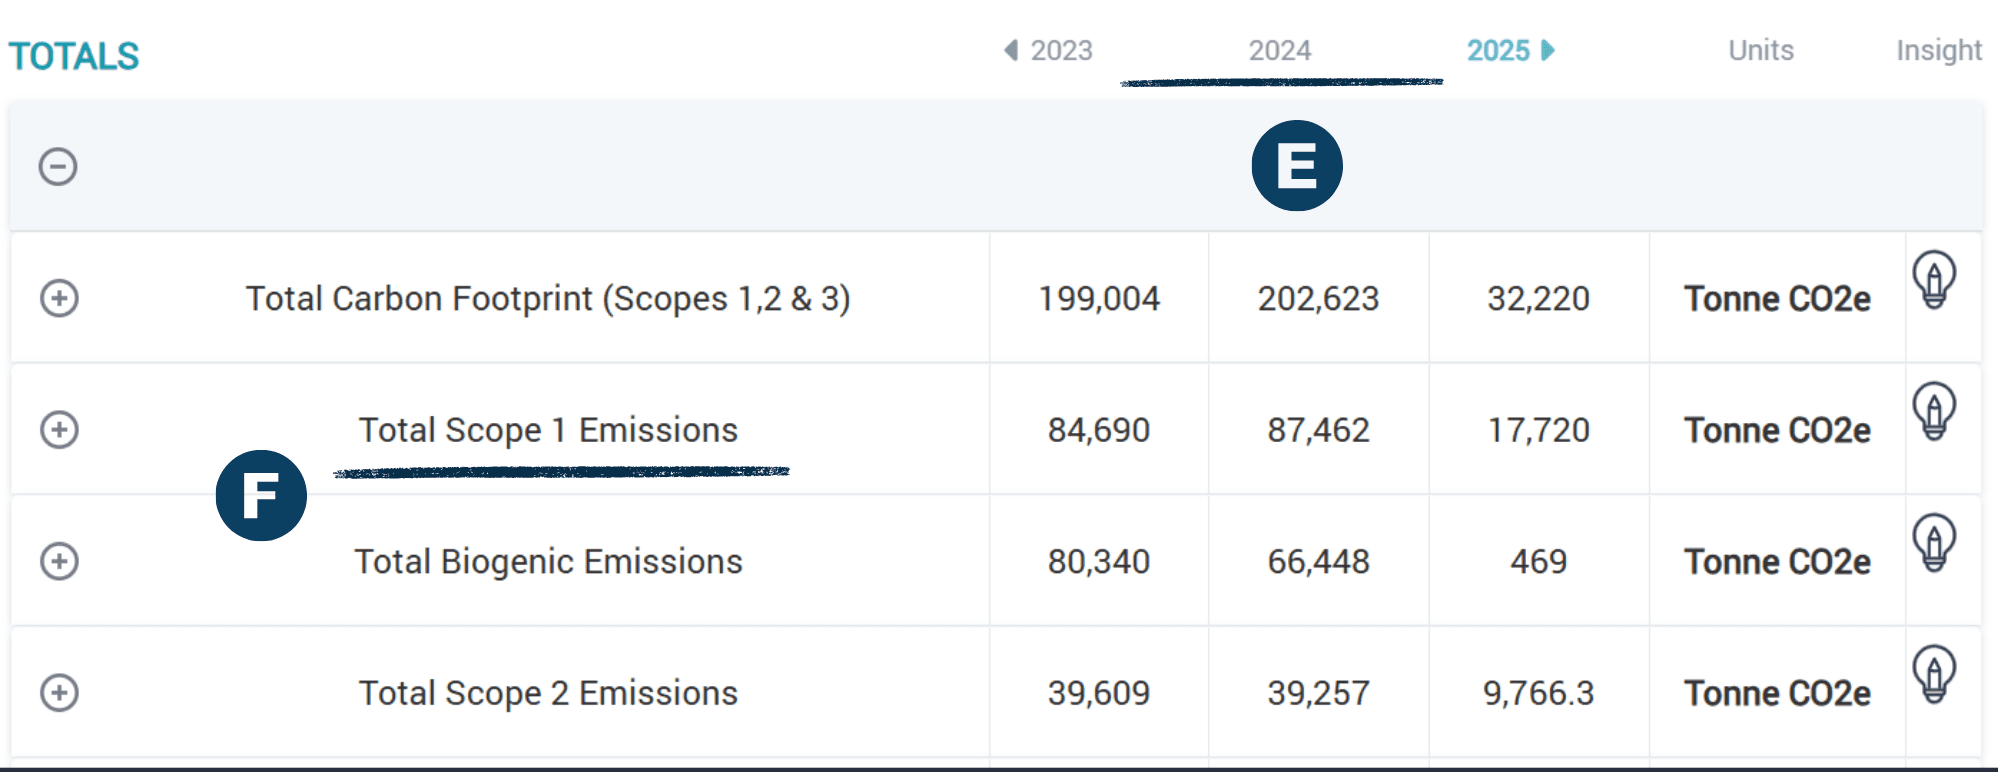
 | Get the 3-year summary of your total carbon footprint. |
 | Drill down into the different emissions categories that make up your total. |
 | |
| |
|---|---|
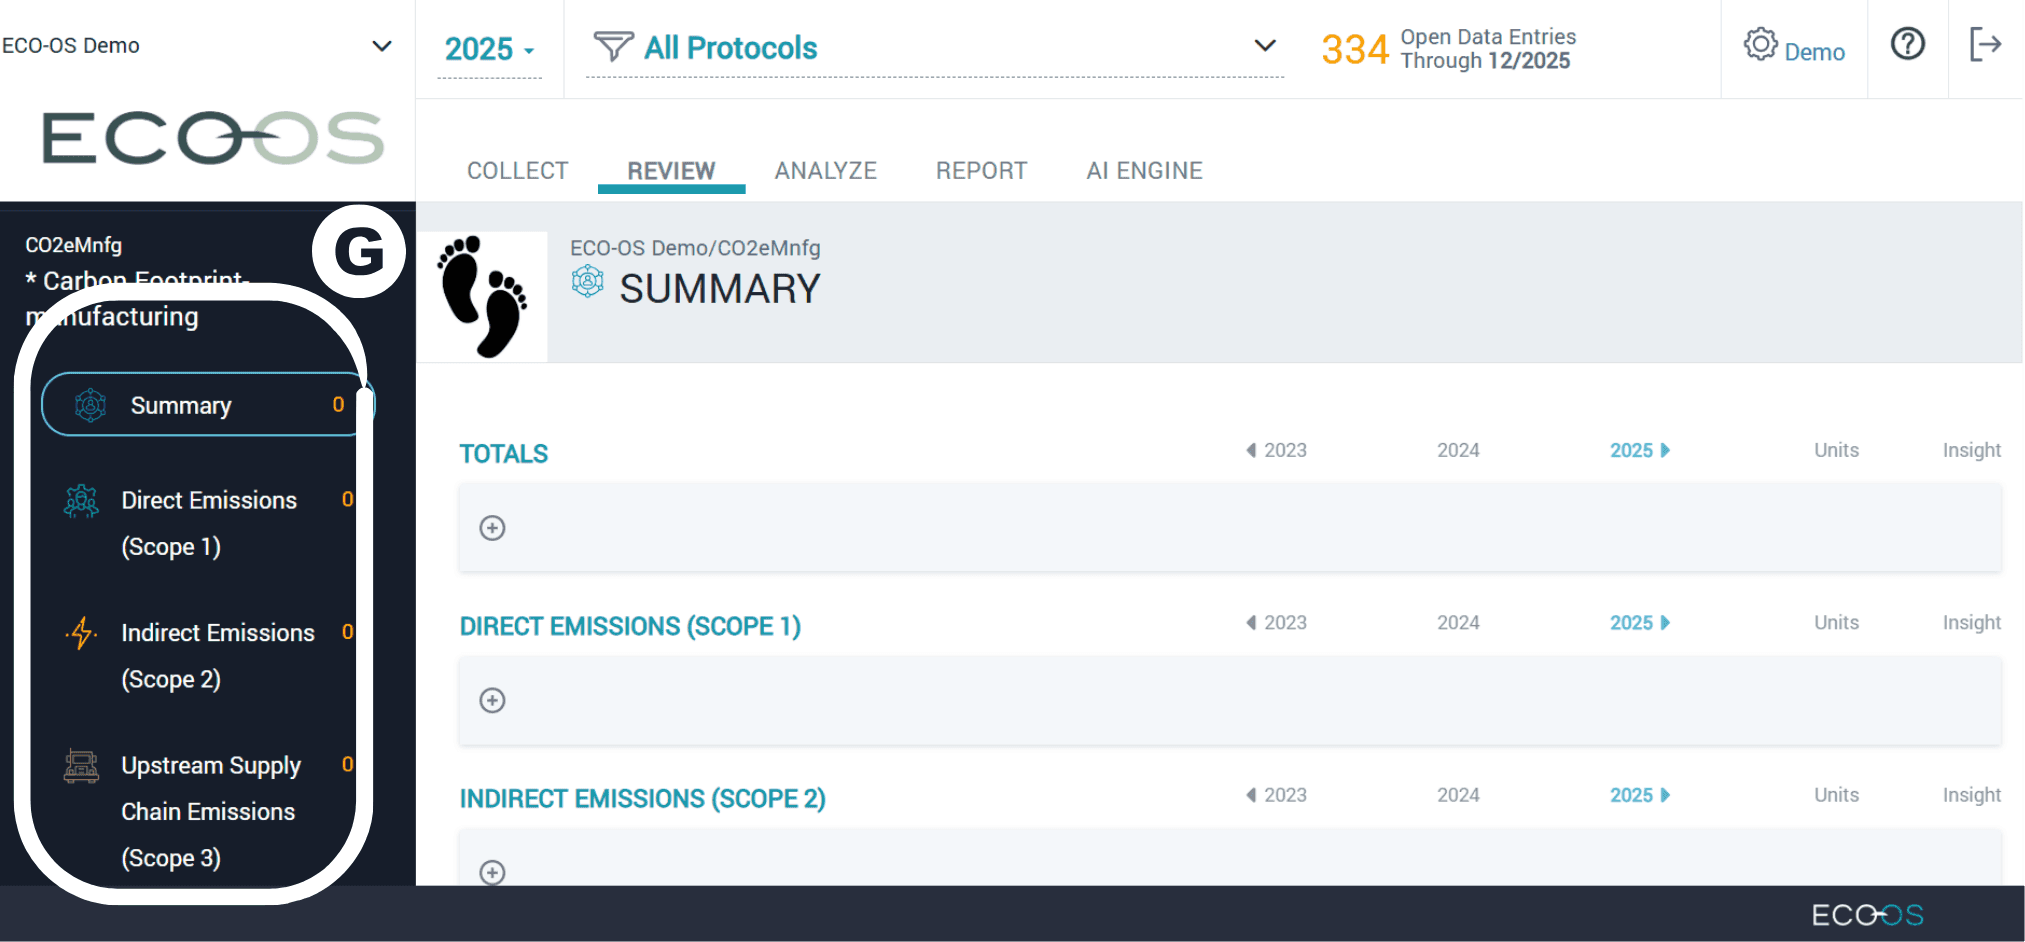
 | After viewing your totals, dive deeper into the results by selecting a category from the left-hand menu. |
 | |
| |
|---|---|
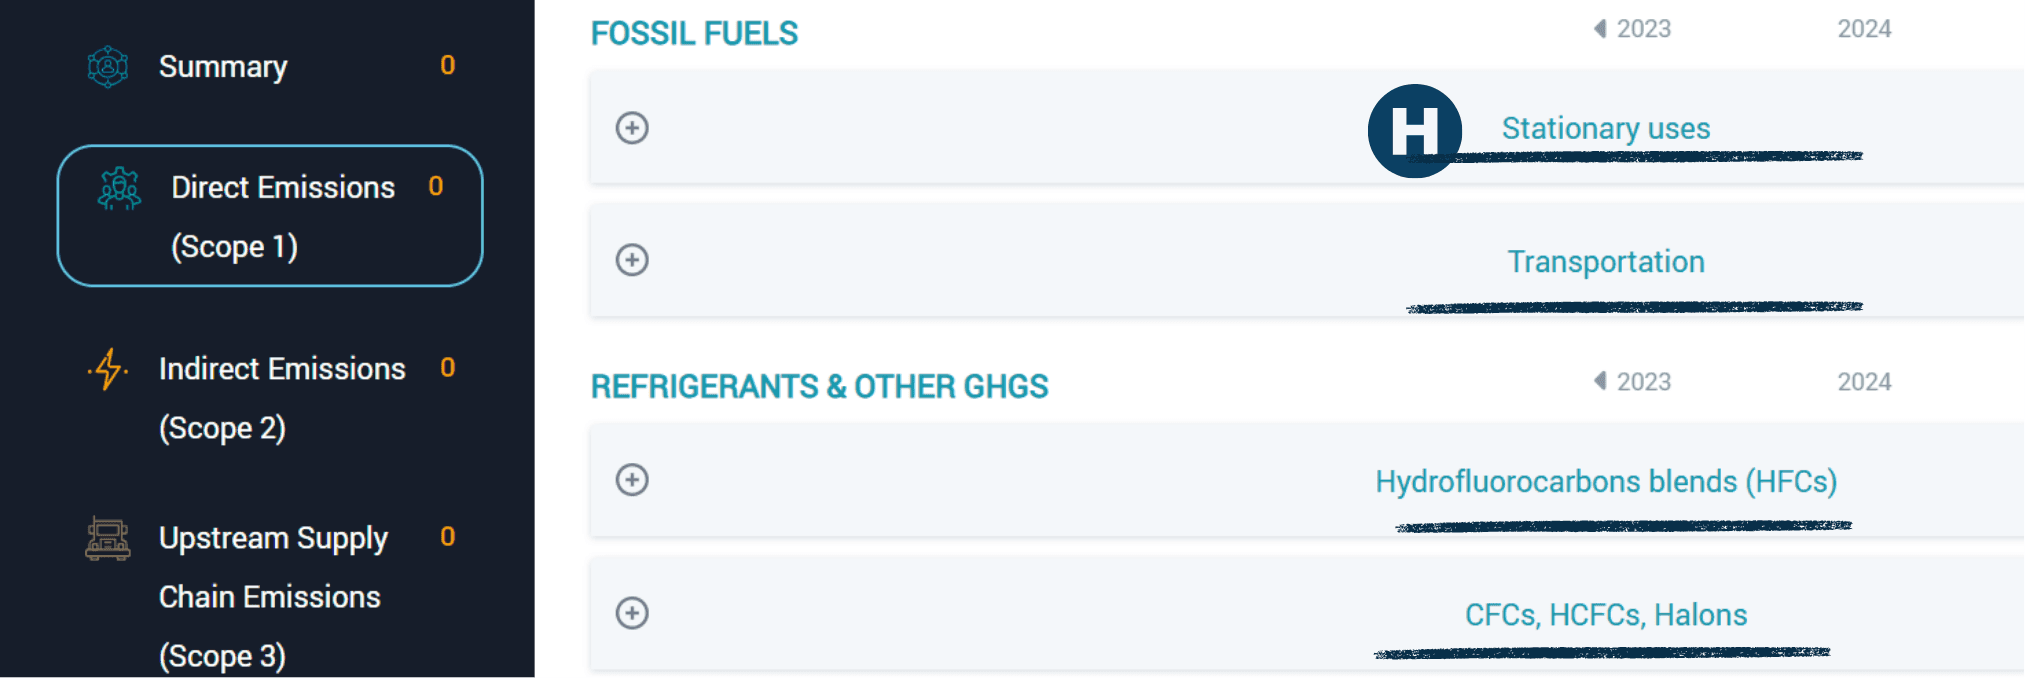
 | Within each emissions category, review the data categories that contribute to your results. For Direct Emissions, for example, these will include mostly fuels and refrigerants. Open each data category for more details. |
 | |
| |
|---|---|
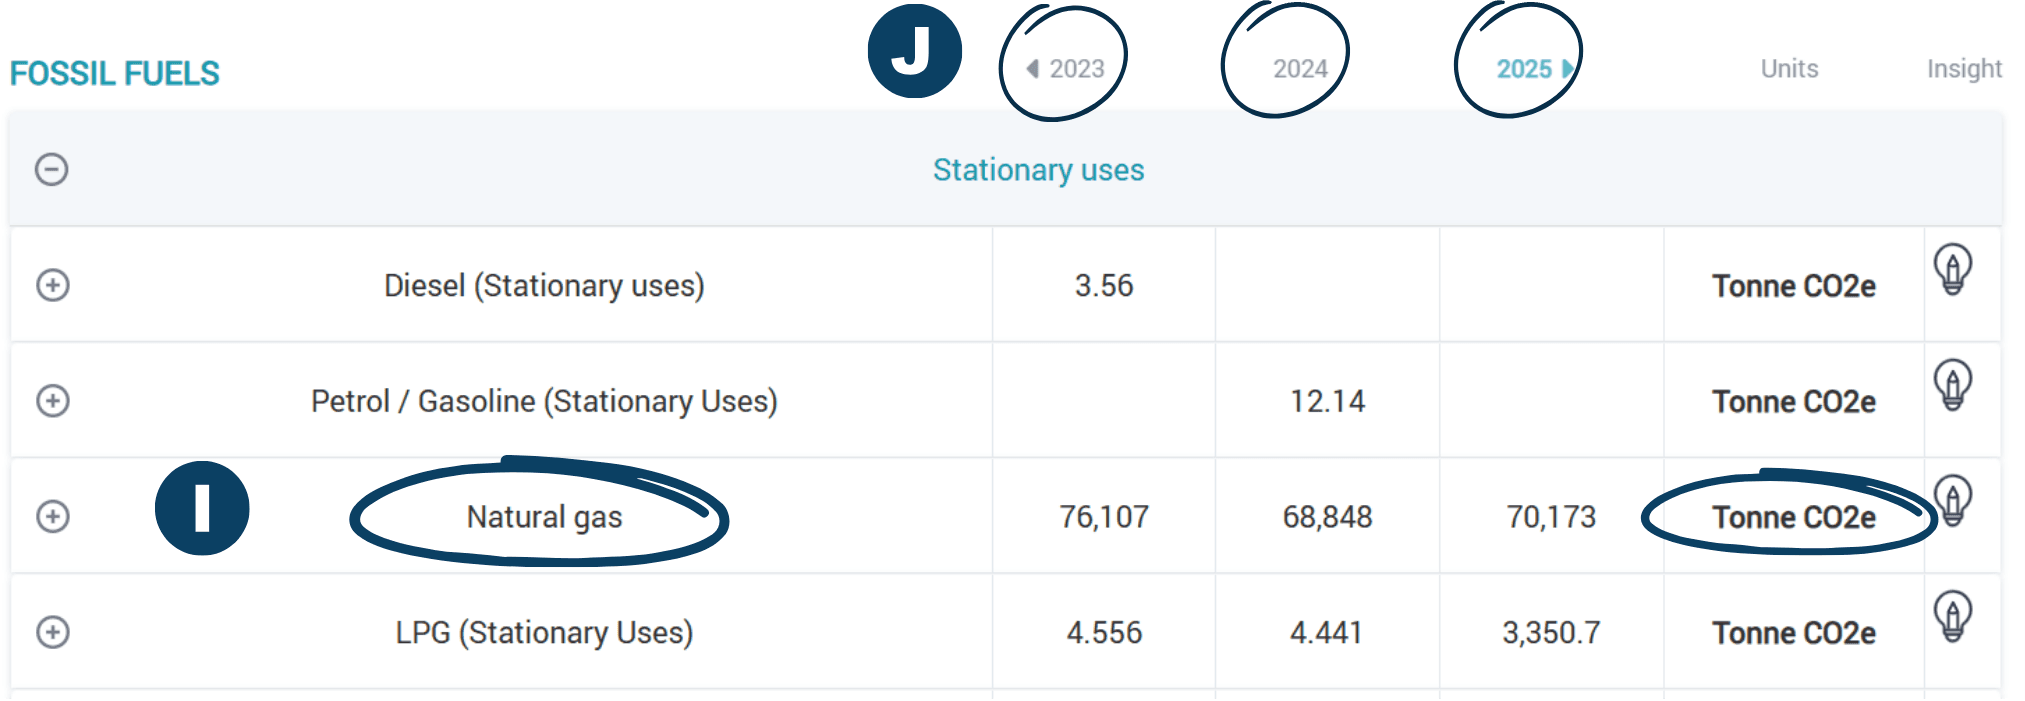
 | View the calculated results of each individual data point for your combined assets in Tonne CO₂e. |
 | Compare results across three years. The year that is currently open on your account will appear in blue. |
 | |
| |
|---|---|
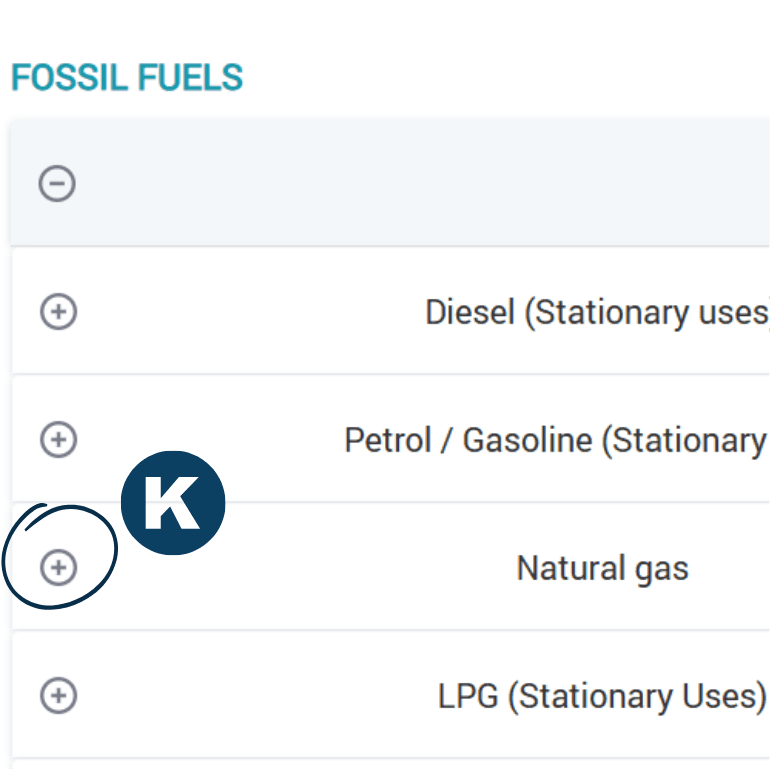
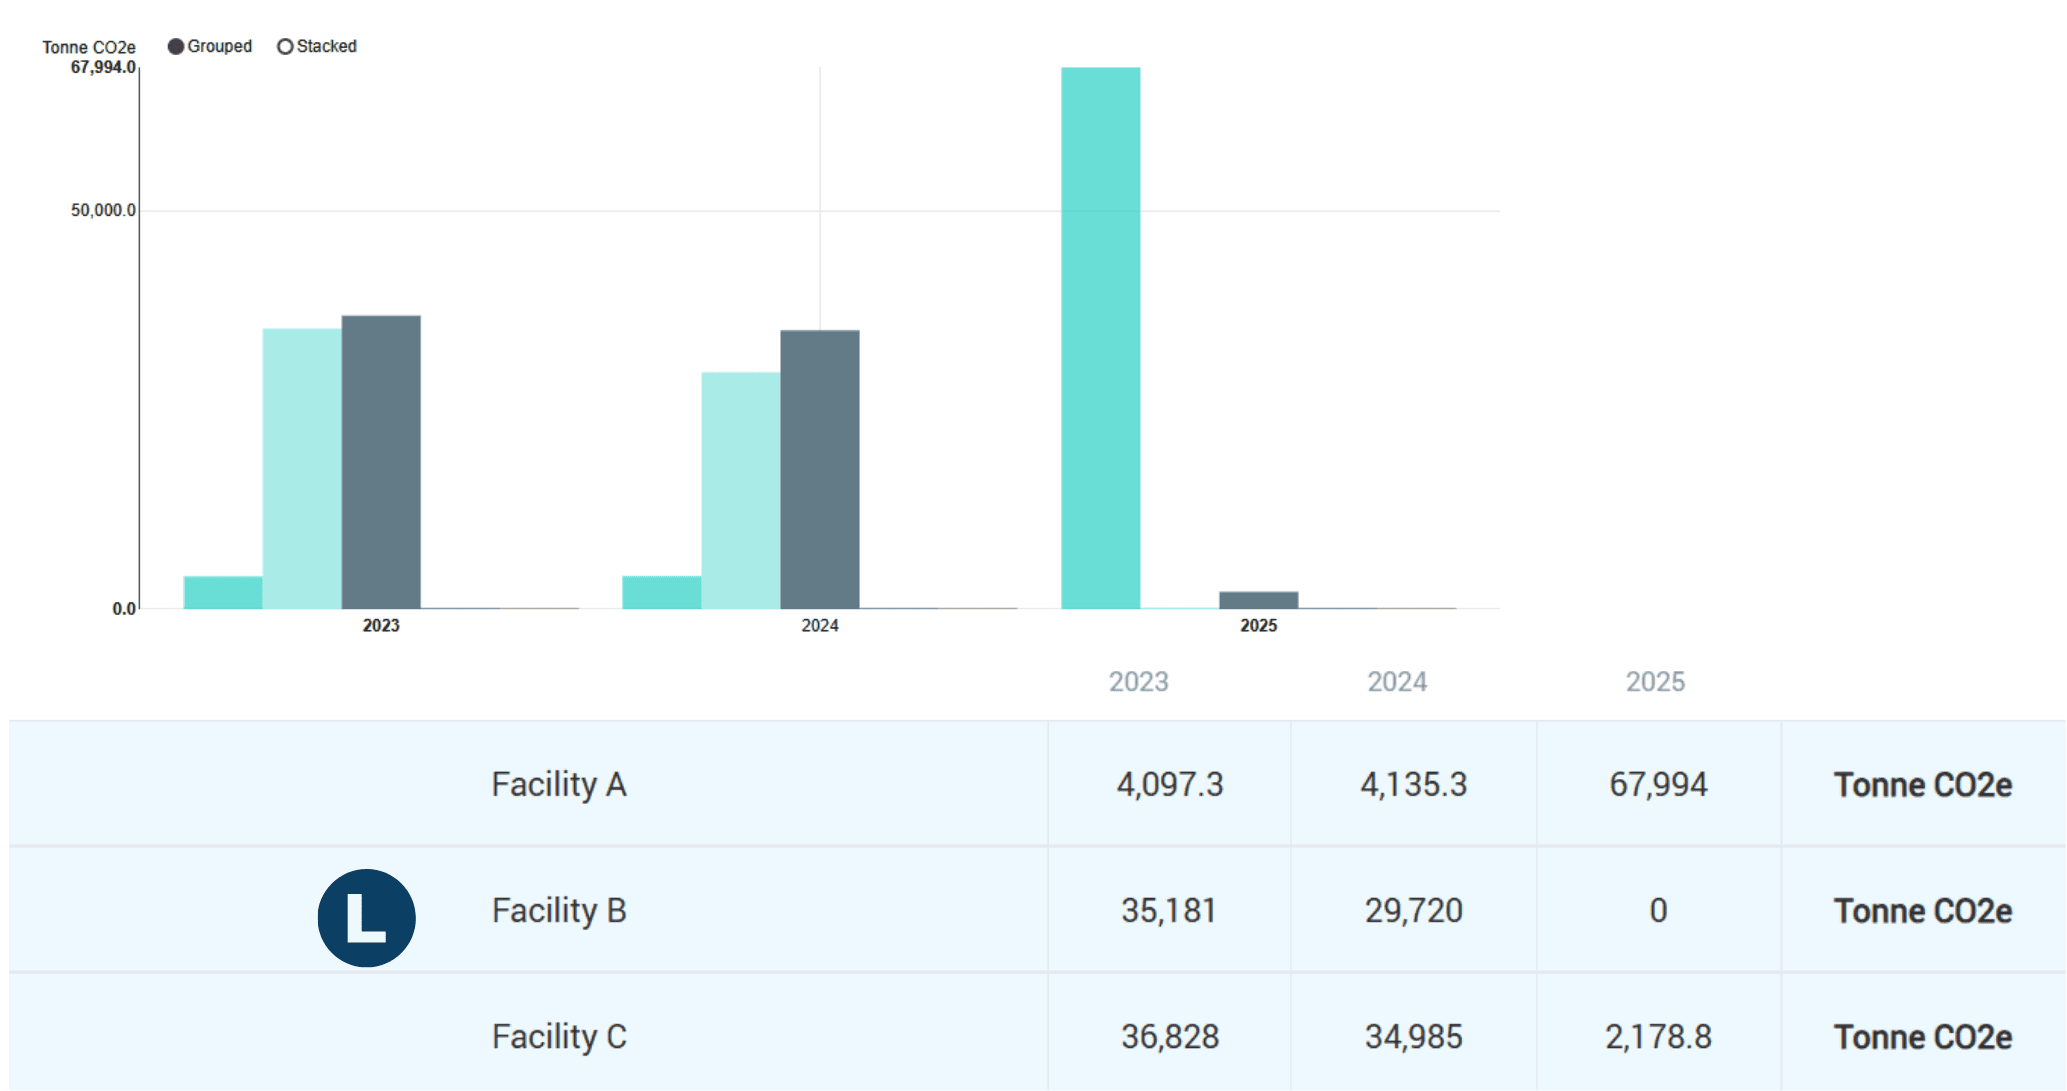
 | Expand the plus sign or click on the data point to open the asset-level breakdown. |
 | |
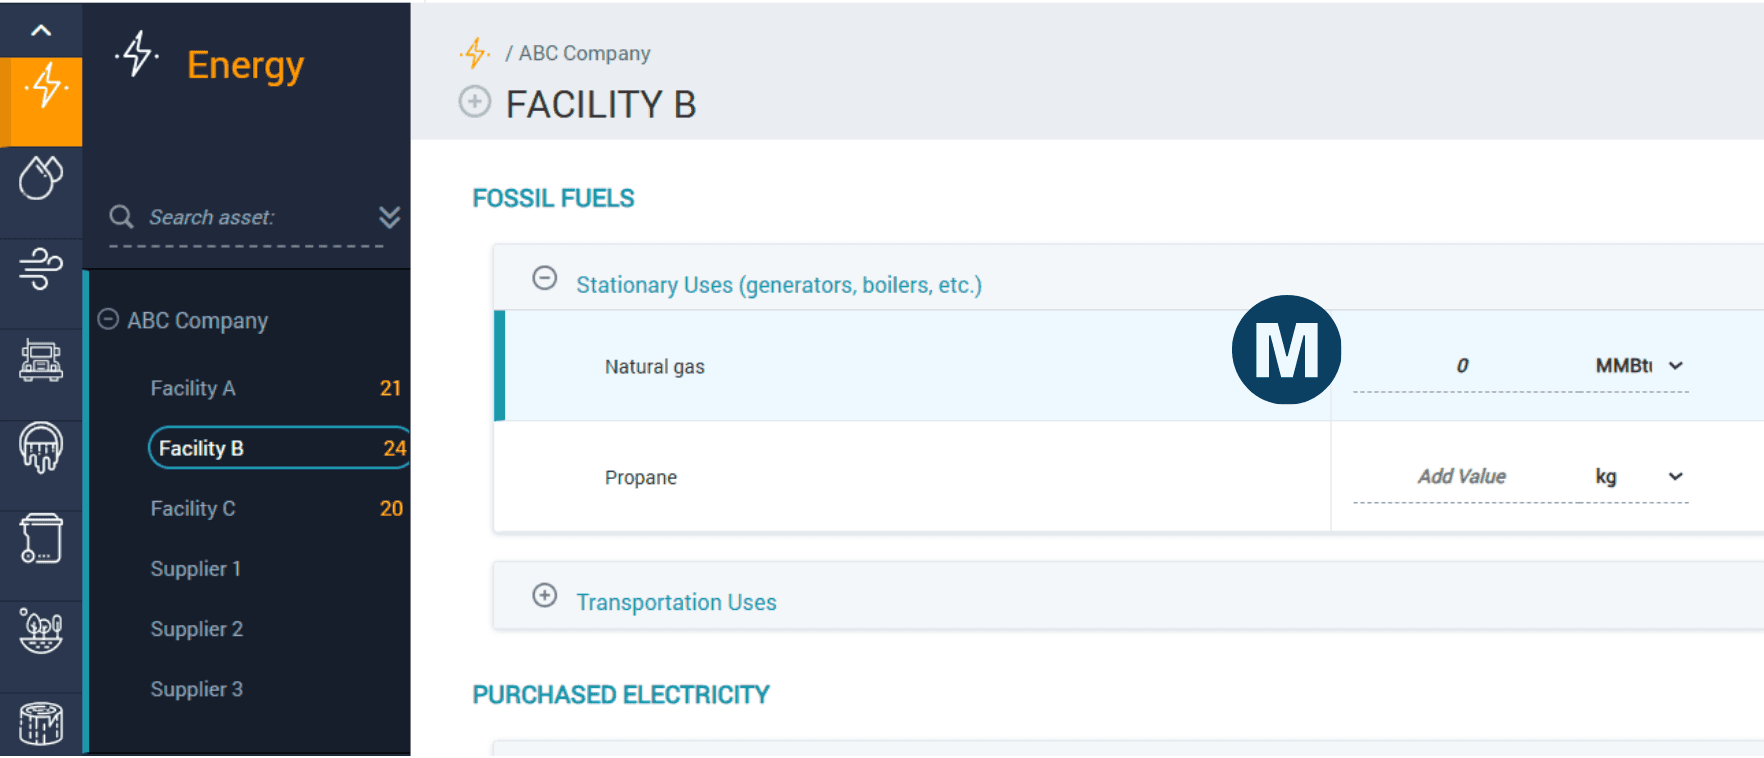
 | See how each asset contributes to your results for that data point. If the data presented appears incorrect, you can select the asset name to return to the Collect Module to view and edit the data directly. |
 | |
| |
|---|---|
 | View and/or edit the data directly in the Collect Module. |
 | |
| |
|---|---|
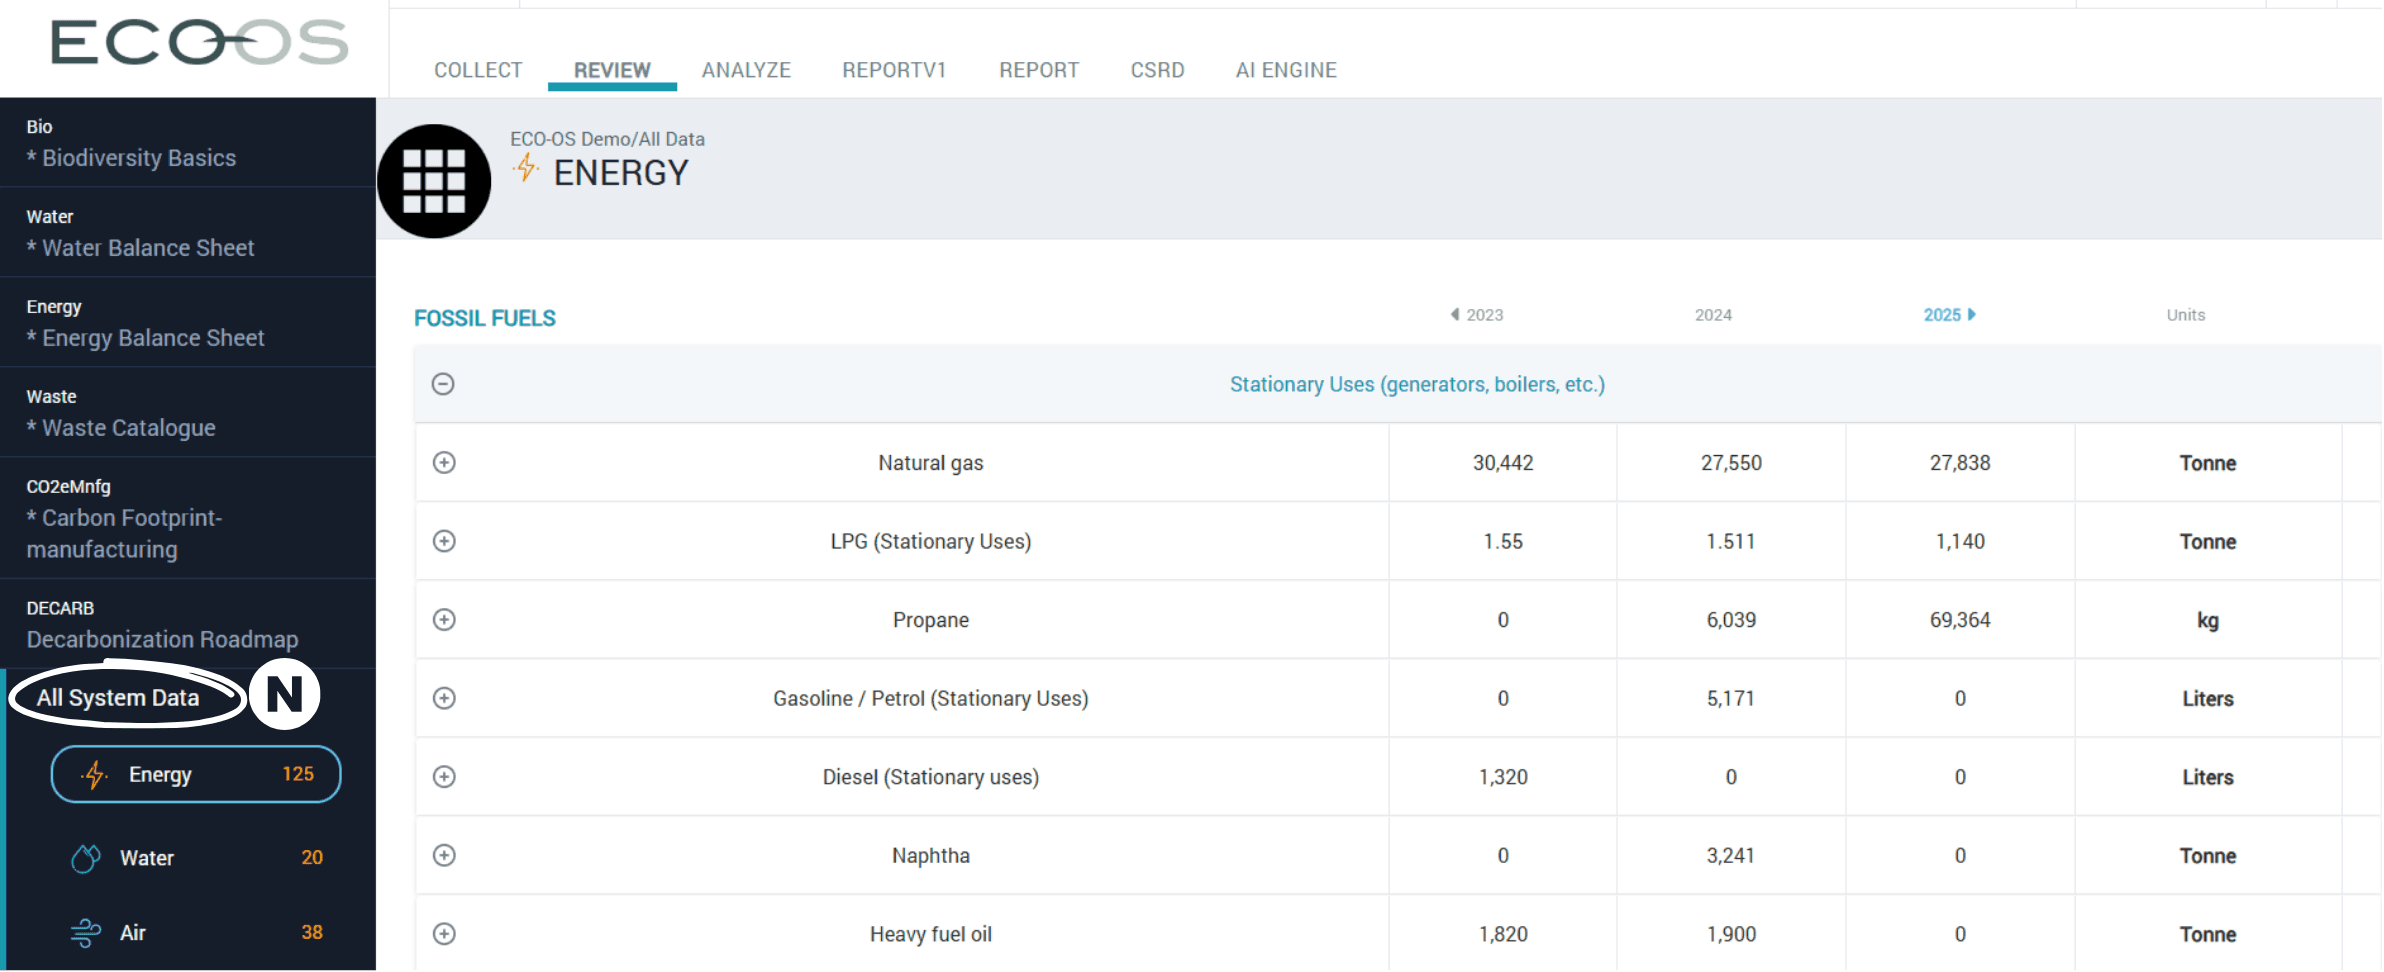
The Review Module can also present your entire raw data set across all categories, broken down to the asset level. | |
 | Select "All System Data' from the left-hand menu or the main Review Dashboard, and view the raw data entered from the Collect Module. Select a data point to open the asset breakdown, as performed in previous steps. |
 | |
| |
|---|---|
| From the main dashboard, click the “Review” tab to enter the Review Module. |
| |
| |
|---|---|
| Select a protocol that you would like to review. |
| Within that protocol, choose the results category to open (e.g. GHG Protocol Summary, Direct Emissions (Scope 1), etc.) |
| |
| |
|---|---|
| Click the ”+” icon to expand the "Totals" section to see a high-level summary of your calculated results. |
| |
| |
|---|---|
| Get the 3-year summary of your total carbon footprint. |
| Drill down into the different emissions categories that make up your total. |
| |
| |
|---|---|
| After viewing your totals, dive deeper into the results by selecting a category from the left-hand menu. |
| |
| |
|---|---|
| Within each emissions category, review the data categories that contribute to your results. For Direct Emissions, for example, these will include mostly fuels and refrigerants. Open each data category for more details. |
| |
| |
|---|---|
| View the calculated results of each individual data point for your combined assets in Tonne CO₂e. |
| Compare results across three years. The year that is currently open on your account will appear in blue. |
| |
| |
|---|---|
| Expand the plus sign or click on the data point to open the asset-level breakdown. |
| |
| See how each asset contributes to your results for that data point. If the data presented appears incorrect, you can select the asset name to return to the Collect Module to view and edit the data directly. |
| |
| |
|---|---|
| View and/or edit the data directly in the Collect Module. |
| |
| |
|---|---|
The Review Module can also present your entire raw data set across all categories, broken down to the asset level. | |
| Select "All System Data' from the left-hand menu or the main Review Dashboard, and view the raw data entered from the Collect Module. Select a data point to open the asset breakdown, as performed in previous steps. |
| |
Have questions about this guide or need more support?
Check out the rest of the ECO-OS Academy content, or contact our support team: support@ecoos.co
Visit the Academy